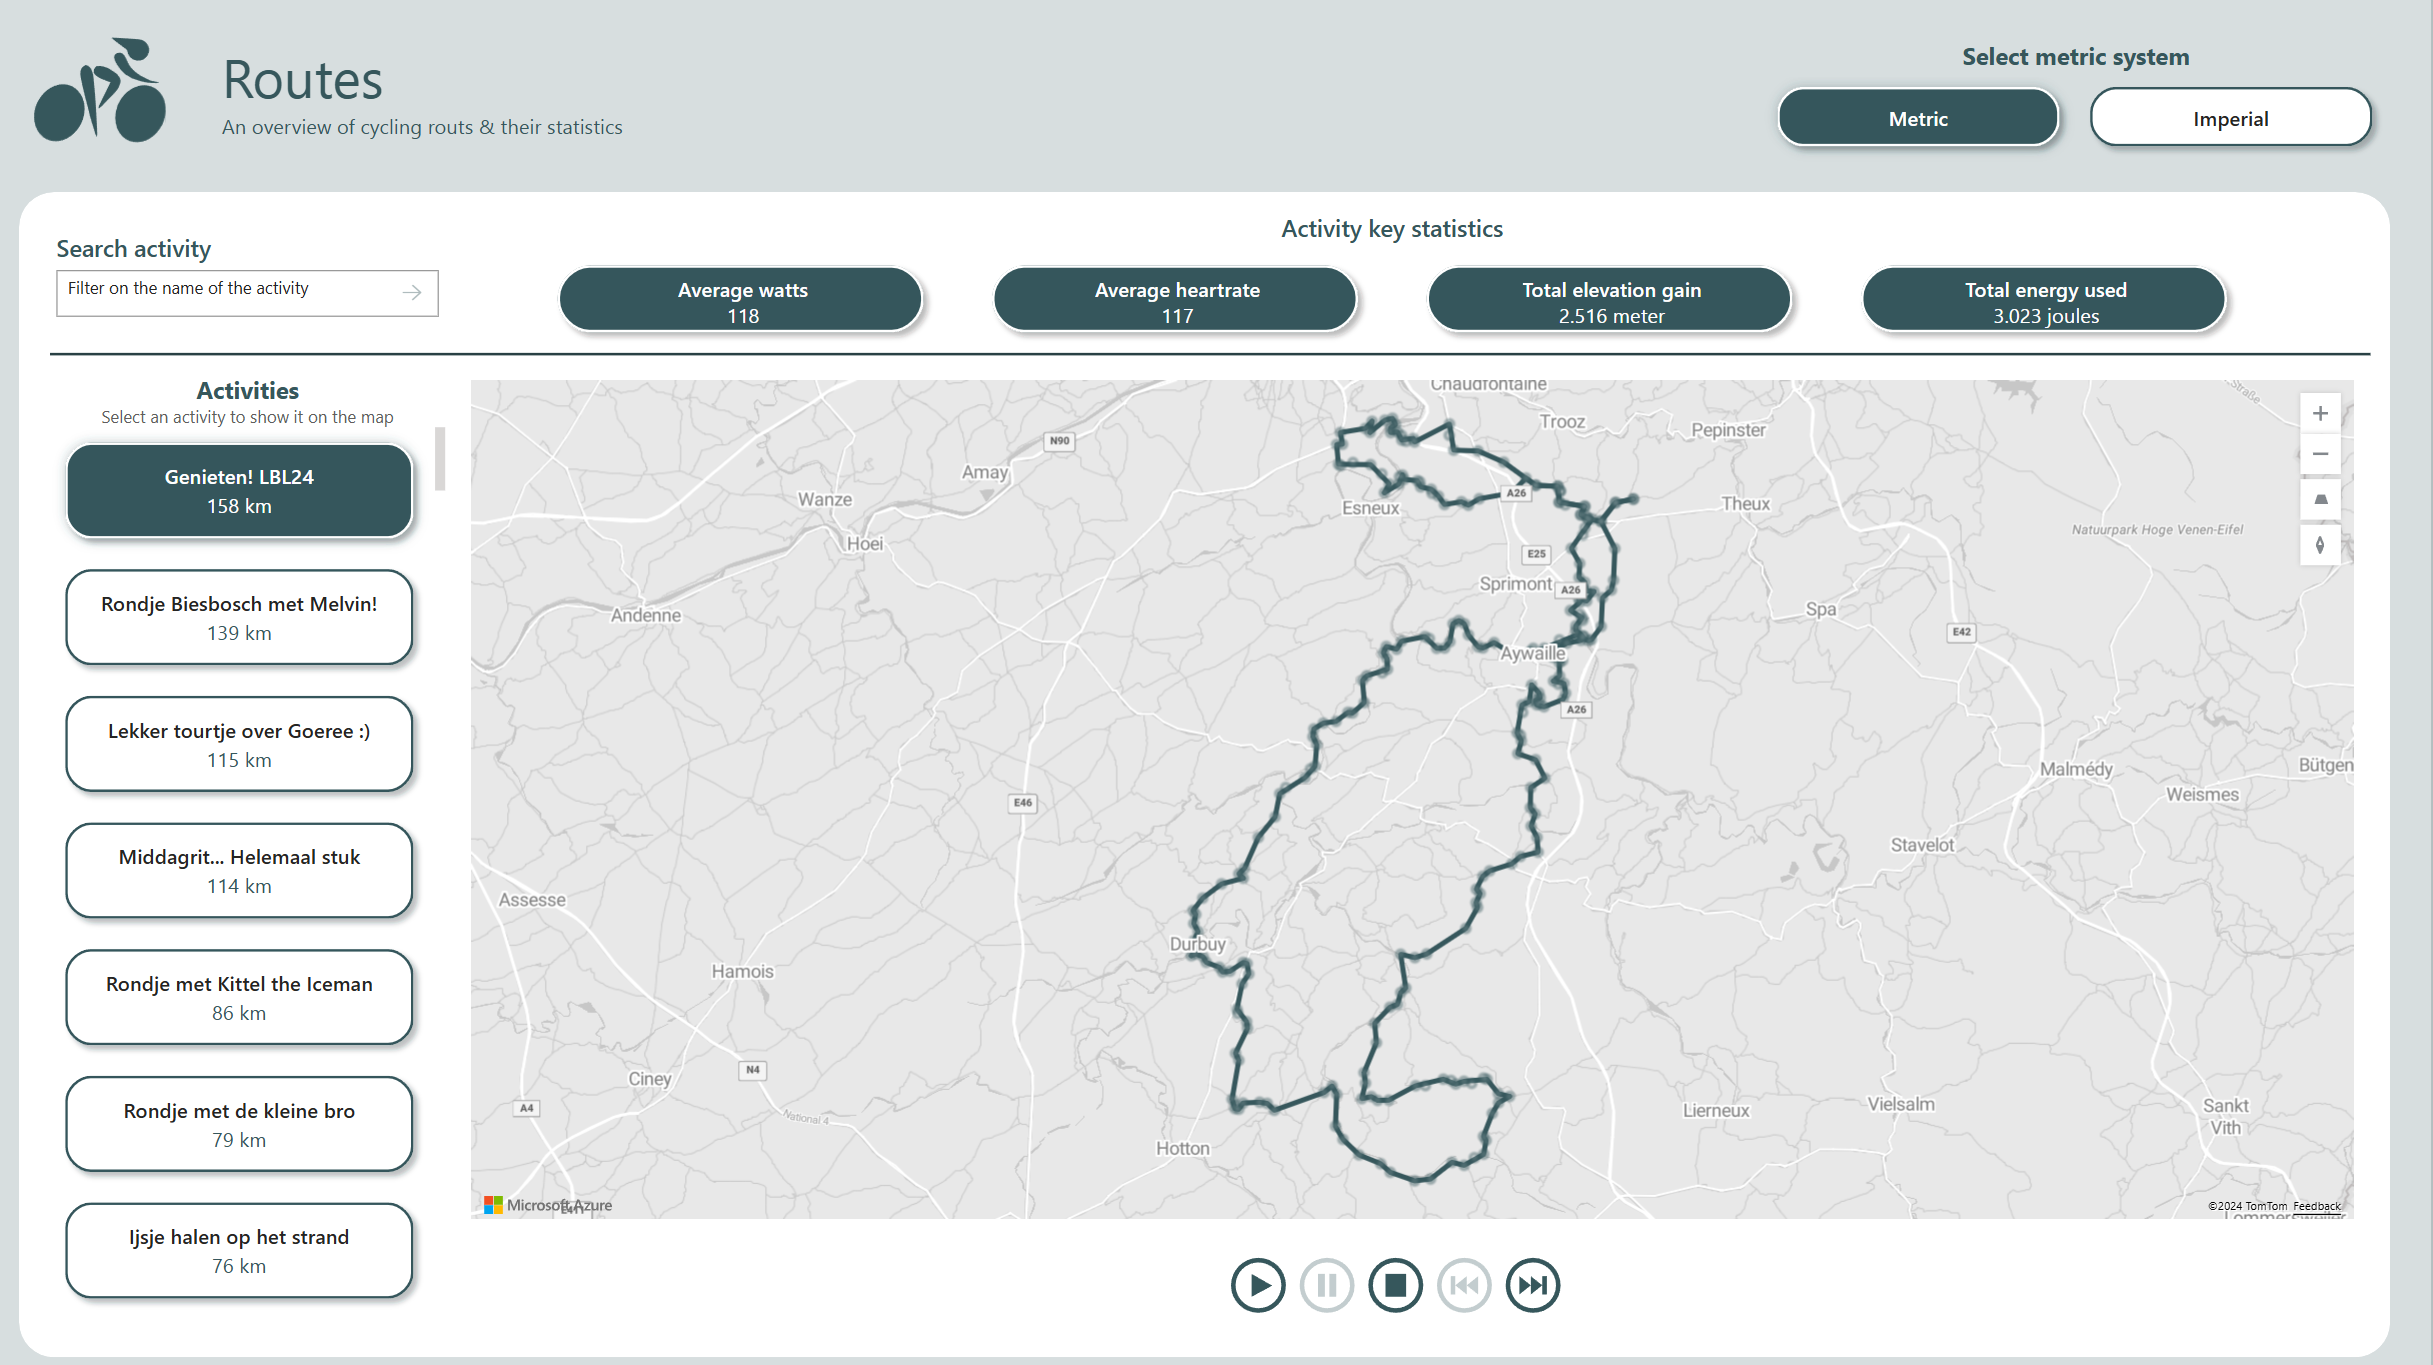
The Power BI team has been doing some awesome work lately with the Azure Maps Visual. We got a new feature in the maps visual that allows us to show routes on the map. In the example, funny enough a route of a ferry from Vancouver to Vancouver Island I have been on myself, you can see the dots being connected. This gave me the idea to try this out myself with my own cycling data! I want to have the routes visualised on a report page per activity.
Getting there meant a small challenge before I was able to plot the data. The data comes from an app called Strava. Strava provides the map data in an encoded string based on the Google polyline encoding algorithm per activity (an activity begin one bike ride or run or other sports you can log with Strava). Power BI needs coordinates in longtitude and latitude to show datapoints on a map. This meant creating a Python script that decodes the string to coördinates per activity. Luckily for me, there is a module for Python that does this for me! With a simple function I can then easily get all coordinates in a list per activity.
import polyline
def decode_polyline_tolist(polyline_input: str) -> list:
    coordinates = polyline.decode(polyline_input)
    return coordinates
The list is then transposed to rows. After which I can start modelling the data in a star schema and prepare data for visualisation. I already had an existing star schema with other cycling data. That schema already contained a fact table with other details of the activities like distance, heartrate and date of the activity. Since the coordinates have a one to many relationship with the existing fact table, I decided to keep the coordinates in a separate fact table. Maybe I’ll combine them if I can create additional insights. For instance the distance between coordinates so I can also calculated the distance cycled up till that point.
At this point, I only had three of the four elements required to show the data on a map with an actual route. With the coordinates, I could already visualise other things. However, I wanted to visualise the actual route of an activity. The four elements needed:
– Latitude
– Longtitude
– PathID
– Point Order

